


Why are office rents for prime, well-located, new and comprehensively refurbished grade-A space in the West End almost double that of new mid-rise space of equivalent specification in the City core?

Even rents for new and comprehensively refurbished mid-rise grade-A space in secondary locations such as Soho, Fitzrovia and Marylebone are now typically £85-£90/sq ft a year, which would be budget enough to secure a ‘penthouse’ floor in one of the City’s new tower buildings.
Over the last five years, the gap between rents for new and comprehensively refurbished grade-A space located in prime City and West End locations has widened, as Table 2 illustrates.
Why does the large disparity in City and West End office rents exist? Why is the rental gap between the two submarkets increasing and will it continue to do so? The answers to these questions lie in the fundamentally different supply-and-demand dynamics of the two submarkets.
Supply-side constraints are much tighter in the West End - especially in areas such as Mayfair, St James’s, Soho, Fitzrovia and Marylebone - due, in part, to the pattern of property ownership that makes it harder to assemble sites big enough to construct larger office buildings. Restrictive planning policies, biased in favour of conserving historic facades and streetscapes of architectural and cultural importance, and which limit the height of new buildings, also play their part in stymying the ability of developers to expand the stock of office space. The introduction of national planning policies that make it easier for landlords to redevelop office buildings for higher-value residential use has also contributed to a reduction in vacancy levels in the West End.
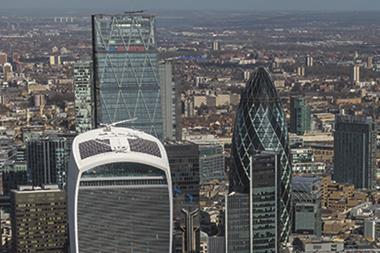
These ownership and planning constraints are less prevalent in the City where the City Corporation has a track record of adopting planning policies that encourage the development of larger, innovative, landmark office buildings that will attract international occupiers - and jobs - to the City. The policy of promoting high-rise development in the City tower ‘cluster’ has spawned a raft of new, iconic, tower buildings, including the Gherkin and the Leadenhall and Walkie-Talkie buildings. Further tower buildings are under construction, including the Can of Ham and The Scalpel, with more planned, including the 73-storey 1 Undershaft (960,000 sq ft) - currently the site of Aviva Tower - and 22 Bishopsgate (1.3m sq ft).
These tower buildings are substantial in scale and contrast sharply with the latest new developments in the West End, including, for example, the Verde building and Nova - both located in Victoria, where most of the larger-scale West End office developments have been concentrated over the last few years.
Supply, then, is an important factor that explains the current disparity in City and West End office rents - but it is not the only reason. Demand plays its part too. The migration of West End tenants to the City over the last few years, in search of better value, is well documented - the latest example being Rathbone Investment Management’s move from Mayfair to 70,000 sq ft at 8 Finsbury Circus, EC2. There has, however, been no mass exodus from the West End. Why?
Some tenants, particularly those in the luxury goods and private equity and wealth management sectors, will simply not consider the City - preferring, instead, the culture of the West End and accessibility to their clientele. Witness the pre-letting of 144,000 sq ft at 1 Fitzroy Place in Fitzrovia to Estée Lauder and the recent 92,000 sq ft letting at the Zig Zag Building in Victoria to Deutsche Bank’s asset and wealth management teams - all the more remarkable because they are relocating from the City, where lower-cost space could potentially have been leased, to be nearer to their West End-based clients. Significantly, the operating models of firms drawn from these business sectors are such that they can afford to bear relatively high property costs. This explains why record-breaking headline rents of £150/sq ft have been achieved recently on lettings at 8 St James’s Square to businesses such as SG Hambros, which are, significantly, drawn from the private equity and wealth management business sectors.
Table 1: Typical office rents - new and comprehensively refurbished mid-rise grade-A space Q1 2016 (£/sq ft pa)
| City core | West End Prime | City secondary | West End secondary |
|---|---|---|---|
| 62.50 – 77.50 | 110.00 – 150.00 | 57.50 – 75.00 | 75.00 – 90.00 |
| City prime = Gracechurch Street, Leadenhall Street, Fenchurch Street | |||
| City secondary = Blackfriars, Old Bailey, Liverpool Street | |||
| West End prime = Berkeley Square, St James’s Square | |||
| West End secondary = Marylebone, Fitzrovia, Soho | |||
Table 2: Rental growth - new and comprehensively refurbished mid-rise grade-A space Q1 2011 - Q1 2016 (£/sq ft pa)
| City core | Prime West End | |||
|---|---|---|---|---|
| Q1 2011 | Q1 2016 | Q1 2011 | Q1 2016 | |
| Headline Rent | 52.50 – 58.50 | 62.50 – 77.50 | 87.50 – 97.50 | 110.00 – 150.00 |
| Increase | 10.00 – 19.00 | 22.50 – 52.50 | ||
| % Increase | 19.0 – 32.5% | 25.7 – 53.8% | ||
Source: Carter Jonas Research
Eyes on the future
So what of the future? My hunch is that City rents will continue to lag behind those in the West End for a variety of reasons:
- Supply in the City is less constrained due to a more ‘developer-friendly’ planning regime. The higher volume of new floor space under construction in the City due for completion in the next 18 to 30 months is in sharp contrast to the West End, making the City office market more vulnerable to an economic downturn and with a higher probability that rents will fall further than those in the West End.
- Crossrail will open up new business districts, including Stratford and Royal Albert Dock at Silvertown, which will incorporate up to 2.5m sq ft of offices. Crossrail will also reduce journey times to established business districts including Canary Wharf and the adjoining New Phase, which will incorporate 1.9m sq ft of offices when complete. Transport infrastructure improvements are therefore likely to put downward pressure on City rents as landlords from neighbouring business districts in the east compete for tenants. The effect of Crossrail on West End office rents is likely to be more benign because the Crossrail route to the west of central London is predominantly residential in nature. Crossrail will also enhance the accessibility of the West End to Heathrow, which is likely to reinforce the attraction of the area for those businesses that are heavy airport users.
- The 2017 business rates revaluation is likely to push up occupation costs in the City disproportionately more than in the West End as rateable values, which have hitherto been at a significant discount to the West End, play ‘catch-up’ and are realigned to reflect City core rental growth of more than 40% since the second quarter of 2010, when the current rating list became effective, based on Carter Jonas research.
- The more diverse West End tenant mix is likely to be more robust in an economic downturn in contrast to the City, which is dominated by the financial services industry and therefore more susceptible to fluctuations in global markets. There may, therefore, be fewer redundancies or business failures among West End occupiers if the world economy falters, resulting in a lower level of vacant floor space reaching the market in a downturn - and reduced downward pressure on rents.
So where will City and West End rents be in 2020? I would hazard a guess that rents for new mid-rise office space in the City core will continue to remain appreciably lower than their counterparts in the West End. This reflects £73-£90.50/sq ft in the insurance district and £134-£182/sq ft for prime Mayfair and St James’s space, reflecting lower average rates of compound annual rental growth of approximately 4% and 5% respectively. This is in contrast to the growth rates of the last few years, acknowledging that supply in both submarkets will begin to play catch-up over the next 18 to 30 months. My predictions assume no macro-economic shocks. In a world of uncertainty this is a big assumption, but for those who know me I am instinctively an optimist.
Michael Pain, head of London tenant advisory team, Carter Jonas
![]()
About Carter Jonas
Carter Jonas LLP is a leading UK property consultancy working across commercial property, residential sales and lettings, rural, planning, development and national infrastructure.
Supported by a national network of 36 offices and 700 property professionals, our commercial team are renowned for their quality of service, expertise and the simply better advice they offer their clients.


No comments yet