


Eighty per cent of quodophiles attribute the phrase “lies, damned lies and statistics” to Mark Twain, 30% reckon it was Benjamin Disraeli and 10% can’t count.

Statisticians of course can count. It’s just what they count (and what they don’t count) that matters. By judiciously selecting the dates to start and end their x-axes they can make just about any theory stack up.
As an equities analyst, I myself might occasionally have been tempted to ‘cherry pick’ to support entrenched predictions or valuations. But in the belief that most of my clients may be sharper-eyed than I am, I’ve generally resisted.
So it was with some interest that I downloaded the Home Builders Federation’s (HBF) report ‘Ghost towns - the true level of housing supply and the official statistics that ignore 30,000 new homes per year’.
‘Flawed methodology’?
The report claims that the DCLG’s data on housebuilding starts and completions, which have been the bread and butter of industry statisticians for decades, employ “inferior” methodology and data.
“Flawed methodology and poor returns from local authorities excludes one-fifth of all new-build homes [in England],” it declares. “The equivalent of a town of Stevenage is ‘lost’ in these statistics each year.”
I looked at the original data on www.gov.uk. The “inferior” series is the quarterly ‘Permanent dwellings completed, by tenure and country’. For 2014-15, there were 124,640 new homes completed. But the HBF argues that the “best, most robust statistics” lie within the annually released ‘Components of net housing supply, England’. This shows that new-build completions totalled 155,080 in the same fiscal year.
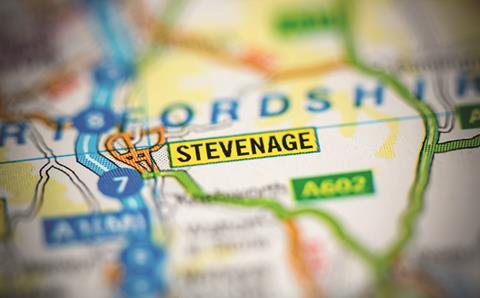
A gap of 30,440, not quite Stevenage, which registered housing stock of 34,898 in the latest census, but let’s not split hairs. The higher figure was a whopping 24% above the lower.
But the report’s rhetorical x-axis begins and ends in 2014-15. Ten years of data are available and show the discrepancy between the two measures has been persistent - but highly cyclical. The next highest “delta” was 17% in 2007-08, the peak of the last cycle.
The average discrepancy over the 10 years has been 17,163 homes, a 13% divergence and roughly a Leamington Spa rather than a Stevenage. In fact, in 2009-10, about the low point of the slump, it dropped to 4%, or 4,280 homes - a tad smaller than Tewkesbury.
Wax and wane
Why the discrepancy? My theory is that the more widely used data is supplied by councils, which may be overwhelmed by the sheer weight of lots from small buildersthey have to chase during boom times; thus accuracy waxes and wanes with activity.
However, the net supply figures are dependent on housing flow recognitions (HFRs), which are used by councils to determine their council tax base - hence there is a far greater incentive to root out every new home.
Nevertheless, in 2015, the HBF described figures from the now derided Starts & Completions series as “the favoured measure of housebuilding”. It has lobbied government for years about how few homes were being built, using starts data, possibly to push for planning concessions.
But now it is choosing to highlight a once virtually ignored data series in order to stress how many homes they are producing. Could this be a message to Philip Hammond ahead of the Autumn Statement - perhaps prompted by Gavin Barwell’s hints at RESI about seeking other providers to boost housing volumes?
Alastair Stewart is an equities analyst and commentator


No comments yet