


Where in the UK is the best place to live? Location specialist CACI ranks the country’s hottest housing locations.

The UK’s top places to live
The data has been collected, the numbers have been crunched and Property Week can exclusively reveal that the best place to live in the UK is (drumroll please) Edinburgh. Last year, the Scottish city ranked fifth in our table of the ‘top 50 best places to live’ survey, collated by location specialist CACI, but this time around it usurped Crewe to take top spot on the Hot Housing Index.
The top 50 is still dominated by areas outside London and the South East and tends to be driven by affordability.
“There are 12 areas from the North West and 11 from Scotland in the top 50 and these are the most affordable regions in the UK to live,” says John Platt, principal consultant in CACI’s property consultancy group.
“We define ‘affordability’ as the relationship between house price and household income. The average property in the UK costs 7.4 times the average household income. In some areas of Scotland and the North East, this can be as low as three times. To put that into context, the London average is 12 times and in the least affordable place to live in the UK, the Royal Borough of Kensington and Chelsea, it is 40 times.”
For the first time, a London location broke into the top 50, with Wandsworth ranking 30th. Its inclusion was down to a high score against a new CACI metric: ‘propensity to move’ (see methodology), which has been the biggest driver of change in this year’s index.
“It has resulted in some of the larger cities outside the south, such as Aberdeen, Leeds, Glasgow, Cardiff and York, climbing the ranking significantly,” explains Platt. “These cities are home to the demographic groups that are more likely to move house frequently: young, relatively affluent ‘career climbers’ and people ‘starting out’ who tend to socially rent with friends.”
Affordability also means those living outside London and the South East are more likely to move. However, there are other factors at play and only one of the top 10 (Hamilton in Scotland) scores an A grade for affordability.
“This goes to show that an attractive place to live is not always driven by price,” says Platt. “If the offer in the area is right then people will still want to live in these desirable locations.”
TOP 50 UK RESIDENTIAL LOCATIONS
| 2017 rank | 2016 rank | Post town | District | Region | Affordability index | Employment levels | Internet connectivity | School provision | Local amenities | Access to public transport | Propensity to move | Score |
|---|---|---|---|---|---|---|---|---|---|---|---|---|
| 1 | 5 | Edinburgh | Edinburgh, City of | Scotland | C | C | A | A | A | A | A | 72.60% |
| 2 | 1 | Crewe | Cheshire East | North West | C | B | D | A | A | D | D | 69.40% |
| 3 | 4 | Harrogate | Harrogate | Yorkshire and the Humber | D | A | C | A | A | D | D | 68.90% |
| 4 | 10 | Devizes | Wiltshire | South West | D | B | C | A | A | D | A | 68.90% |
| 5 | 35 | Aberdeen | Aberdeen City | Scotland | B | C | E | B | A | A | A | 68.40% |
| 6 | 2 | Chester | Cheshire West and Chester | North West | C | B | D | A | A | C | D | 68.20% |
| 7 | 12 | Bristol | South Gloucestershire | South West | D | B | B | A | B | B | A | 67.90% |
| 8 | 3 | Stockport | Stockport | North West | C | C | A | A | A | B | D | 67.60% |
| 9 | 6 | Hamilton | South Lanarkshire | Scotland | A | D | A | A | A | B | D | 67.40% |
| 10 | 8 | Warrington | Warrington | North West | B | C | B | A | B | B | C | 67.20% |
| 11 | 9 | Inverurie | Aberdeenshire | Scotland | B | A | E | A | B | E | D | 67.20% |
| 12 | 20 | Nottingham | Rushcliffe | East Midlands | C | A | A | D | D | B | B | 66.30% |
| 13 | 11 | Sale | Trafford | North West | D | C | B | A | A | B | C | 66.00% |
| 14 | 25 | Leeds | Leeds | Yorkshire and the Humber | B | D | B | A | A | A | A | 65.90% |
| 15 | 43 | Glasgow | Glasgow City | Scotland | A | E | C | A | A | A | A | 65.10% |
| 16 | 7 | Beverley | East Riding of Yorkshire | Yorkshire and the Humber | B | B | D | A | A | E | E | 64.80% |
| 17 | 13 | Perth | Perth & Kinross | Scotland | B | B | D | A | B | C | D | 64.70% |
| 18 | 38 | Cardiff | Cardiff | Wales | C | D | C | A | A | A | A | 64.70% |
| 19 | 31 | Clevedon | North Somerset | South West | C | B | D | B | B | D | A | 64.20% |
| 20 | 50 | York | York | Yorkshire and the Humber | C | B | D | C | A | B | A | 63.80% |
| 21 | 24 | Kirkcaldy | Fife | Scotland | A | D | B | A | A | B | C | 63.50% |
| 22 | 14 | Chorley | Chorley | North West | A | B | B | B | D | B | D | 63.30% |
| 23 | 18 | Bury | Bury | North West | A | C | C | B | B | B | C | 63.10% |
| 24 | 28 | St Albans | St Albans | East of England | E | A | B | B | B | C | C | 63.10% |
| 25 | 22 | Paisley | Renfrewshire | Scotland | A | E | A | B | B | A | C | 63.00% |
| 26 | 19 | Leyland | South Ribble | North West | A | A | B | C | E | B | D | 62.90% |
| 27 | n/a | Towcester | South Northamptonshire | East Midlands | C | A | C | C | E | E | B | 62.90% |
| 28 | 26 | Swansea | Swansea | Wales | B | C | A | A | B | B | C | 62.80% |
| 29 | 48 | Aylesbury | Aylesbury Vale | South East | D | B | B | A | C | D | B | 62.70% |
| 30 | n/a | London | Wandsworth | London | E | C | C | B | A | A | A | 62.70% |
| 31 | n/a | Loughborough | Charnwood | East Midlands | C | B | B | C | C | B | A | 62.40% |
| 32 | 49 | Leamington Spa | Warwick | West Midlands | D | A | B | C | B | B | B | 62.40% |
| 33 | 15 | Liverpool | Sefton | North West | B | D | A | A | A | A | E | 62.40% |
| 34 | 46 | Reading | West Berkshire | South East | D | A | E | B | C | D | B | 62.30% |
| 35 | 21 | Livingston | West Lothian | Scotland | A | D | B | B | C | B | D | 62.30% |
| 36 | n/a | Bath | Bath and north-east Somerset | South West | E | B | D | B | A | B | A | 62.20% |
| 37 | 16 | Solihull | Solihull | West Midlands | C | C | A | B | B | B | D | 62.20% |
| 38 | 29 | Stafford | Stafford | West Midlands | B | B | B | C | C | D | D | 62.10% |
| 39 | n/a | Lancaster | Lancaster | North West | B | B | A | B | B | B | B | 62.00% |
| 40 | 17 | Glasgow | East Dunbartonshire | Scotland | B | B | A | C | E | C | E | 61.60% |
| 41 | 33 | Bolton | Bolton | North West | A | E | A | A | A | B | C | 61.60% |
| 42 | 32 | Airdrie | North Lanarkshire | Scotland | A | E | A | A | B | B | D | 61.50% |
| 43 | 34 | Huddersfield | Kirklees | Yorkshire and the Humber | A | D | C | A | A | C | C | 61.40% |
| 44 | n/a | Wokingham | Wokingham | South East | D | A | D | B | D | D | B | 61.10% |
| 45 | n/a | Preston | Preston | North West | A | D | C | B | B | A | A | 61.10% |
| 46 | 23 | Shrewsbury | Shropshire | West Midlands | C | A | E | A | A | D | E | 61.00% |
| 47 | 27 | Durham | County Durham | North East | A | D | D | A | A | C | D | 61.00% |
| 48 | 47 | Stockton-on-Tees | Stockton-on-Tees | North East | A | E | A | B | B | B | C | 60.90% |
| 49 | n/a | Leicester | Harborough | East Midlands | C | A | B | D | D | E | B | 60.80% |
| 50 | 37 | Ware | East Hertfordshire | East of England | E | A | C | B | C | C | C | 60.80% |
Top five housing hot spots
1. Edinburgh

The Scottish capital moves to the top of the rankings, boosted by the strength of its property market and the high propensity of its residents to move. Edinburgh is also benefiting from considerable investment in its already strong retail offer. The redevelopment of St James Centre, one of the longest-running regeneration projects in the UK, will provide the city with 850,000 sq ft of prime retail space, while the £500m Edinburgh Marina development is set to complete by 2019, adding homes, shops and a hotel to the city. This is likely to boost house prices in the area, increasing the gap between household income and property prices even further.
2. Crewe

Crewe slips one place this year to second, overtaken by Edinburgh, primarily because of its propensity to move score, which was lower than Edinburgh’s. Crewe is exceptionally well connected in terms of both rail and road. It is a huge rail hub with great links to most cities across the North West, making it a desirable location for commuters. It is also set to benefit from an HS2 station, which will reduce journey times to Manchester, Birmingham and London. This strong connectivity has driven up property prices, meaning it isn’t as affordable as some other locations at the top of the ranking. It is, however, more affordable than cities such as Liverpool and Manchester.
3. Harrogate

Harrogate consistently appears near the top of our ranking. The spa town is located directly north of Leeds and to the west of York. It is a highly affluent town with nearly two-thirds of residents belonging to the top two Acorn categories and, as such, property prices are slightly higher than in other locations in the top five. According to the Land Registry House Price Index, the average price of a home in the town is £265,799. Harrogate is often a place associated with older generations, but has very low unemployment and strong school and local amenities. It is also located within commuting distance of York and Leeds.
4. Devizes
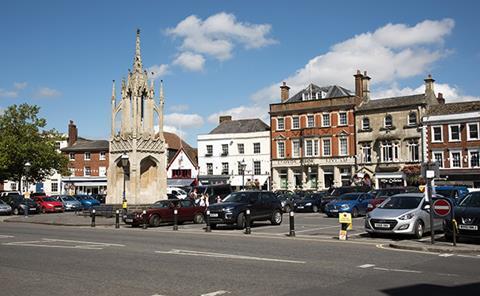
Devizes, a market town located in the heart of Wiltshire, moves six places up the ranking this year to number four. Its South East location means it scores poorly on the affordability metric, but the high levels of employment in the area and the quality of schools and local provisions boost its place in the ranking. It is also home to a relatively high proportion of the population who are likely to move house in the next 12 months, meaning that it is an excellent location for potential property developers. Late last year, Aster Group submitted plans for a 38-home scheme on a brownfield site in Devizes.
5. Aberdeen

Aberdeen in north-east Scotland is well known for its offshore petroleum industry. Due to the slowdown in that industry, housing in the city has become more affordable, with property prices just under five times the average household income, making it more affordable than the other towns and cities in the top five. The increase in affordability has boosted the housing market, with a high proportion of the population likely to move house in the next year. The city is also set to see investment in its retail offer, with plans afoot to extend the main shopping centres, Bon Accord & St Nicholas and Union Square.
How the capital ranks
There are few significant shifts at the top of the London ranking compared with last year but there are four new entries and some big movers further down the ranking. Islington, Southwark, Hackney and Lewisham all enter the rankings and this is largely driven by these locations all scoring highly on the propensity to move variable.
“These boroughs are home to high volumes of young, relatively affluent residents, as well as students, who have a high propensity to rent and therefore move house frequently,” says CACI’s John Platt.
“These boroughs, plus the likes of Wandsworth, Camden and Lambeth further up the rankings, are desirable places to live and particularly to rent in the capital. They represent strong opportunities for private developers and PRS schemes.”

Wandsworth broke into the main Hot Housing Index - the first time a London area has achieved this - thanks to the fact that it has one of the highest potential mover populations in the UK.
Despite the recent slowdown in the housing market, affordability across the capital remains an issue, with every borough in the top 20 scoring the lowest grade possible in terms of affordability.
“Recent CACI analysis shows that only 6% of Londoners could afford to pay the average price for a house in their local area, compared with 67% across the UK,” says Platt.
TOP 20 LONDON RESIDENTIAL LOCATIONS
| 2017 rank | 2016 rank | District | Affordability index | Employment levels | Internet connectivity | School provision | Local amenities | Access to public transport | Propensity to move | Score |
|---|---|---|---|---|---|---|---|---|---|---|
| 1 | 4 | Wandsworth | E | C | C | B | A | A | A | 62.70% |
| 2 | 3 | Richmond upon Thames | E | B | B | C | A | A | B | 60.50% |
| 3 | 2 | Barnet | E | C | D | A | A | A | C | 60.00% |
| 4 | 1 | Bromley | E | C | A | A | A | A | E | 57.40% |
| 5 | 5 | Kingston upon Thames | E | B | B | D | A | A | C | 56.50% |
| 6 | 8 | Camden | E | D | D | C | A | A | A | 55.30% |
| 7 | 9 | Westminster | E | D | E | C | A | A | A | 54.90% |
| 8 | 7 | Lambeth | E | E | C | A | A | A | A | 54.80% |
| 9 | 12 | Hammersmith and Fulham | E | D | D | C | A | A | A | 53.80% |
| 10 | 20 | City of London | E | A | E | E | A | A | A | 53.70% |
| 11 | 11 | Haringey | E | E | B | B | A | A | A | 53.10% |
| 12 | 19 | Kensington and Chelsea | E | C | C | D | A | A | A | 52.50% |
| 13 | n/a | Islington | E | E | E | B | A | A | A | 51.00% |
| 14 | 15 | Ealing | E | D | C | A | A | A | B | 50.90% |
| 15 | n/a | Southwark | E | E | D | A | A | A | A | 50.70% |
| 16 | 10 | Croydon | E | E | B | A | A | A | C | 50.50% |
| 17 | 6 | Sutton | E | C | A | C | B | A | E | 50.50% |
| 18 | n/a | Hackney | E | E | B | B | A | A | A | 50.40% |
| 19 | 18 | Merton | E | C | A | C | B | A | B | 49.90% |
| 20 | n/a | Lewisham | E | E | C | A | A | A | A | 49.70% |
METHODOLOGY
The affordability index was calculated by analysing the relationship between average house price and average income, arriving at a ratio between the variables. Other variables used to create the ranking were: levels of employment; internet connectivity and wifi speed data sourced from Ofcom; public transport accessibility; a count of primary and secondary schools; and a count of the provision of retailers, pubs, restaurants and other local amenities. This year, a new variable was added to the ranking: propensity to move. Working alongside the Institute for Social and Economic Research, using its Understanding Society study, CACI identified key demographic markers that movers have in common. It then compared this with its own database of 48 million UK adults to identify who is statistically most likely to move house in the future. This allows the company to quantify the potential number of movers in any town or city across the UK. Each area has been given a score and an A to E grade for each variable, with A being high and E being low. The score for each variable was then added up to create the overall ranking.


No comments yet