


Location specialist CACI ranks the best places to live in the UK based on factors ranging from affordability to low crime rates

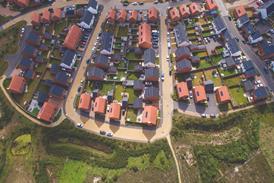
Scottish cities still dominate the top of Property Week’s annual Hot 100 residential ranking, compiled by CACI, but locations in the South East are hot on their trail.
John Platt, a director in CACI’s property consulting group, says that in recent years towns and cities in Scotland and the north of England have dominated the rankings largely due to the affordability factor, but that this year, locations in the South East have dramatically closed the gap.
“The South East is now the joint most prominent region, alongside the North West, making up 16% of the top 100,” says Platt. “London still ranks poorly; very low affordability and high crime rates mean that only four London boroughs make the top 100, Wandsworth being the standout performer, at 23rd.”
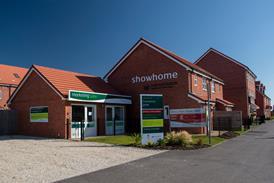
The ranking, which lists the most desirable places to invest in property across the UK based on value for money, takes into account a number of factors (see methodology) and although price is an issue, CACI’s research suggests other considerations are more important to some housebuyers.
“Much has been said in the press over recent months about declining house prices,” says Platt. “This, coupled with a slight increase in average wages, should see the gulf between income and house price come down, but a large proportion of districts in our ranking still score low on overall affordability. Eight of the top 10 are graded C or below for affordability, showing that it is more than just house price that makes an area desirable.”
Among the factors that make locations desirable are low crime rates. As a result, CACI introduced crime stats into the methodology for the first time, which threw up some interesting shifts in the data.
“Areas such as Brighton, Newcastle upon Tyne, Sheffield and Preston have all experienced big rises this year due to relatively low crime rates per head of population,” says Platt.
Also for the first time, the company drew up a list of hot first-time buyer and downsizing locations created using the company’s data on an individual’s likelihood to move house and on age and life stage (p42). Tower Hamlets, Nottingham and Wandsworth topped the list of first-time buyer hotspots, while Christchurch, West Somerset and Rother are the most popular locations for those looking to downsize.
TOP 50 UK RESIDENTIAL LOCATIONS
| Rank ‘18 | Rank ‘17 | Post town | District | Region | Affordability index | Employment levels | Internet connectivity | School provision | Local amenities | Access to public transport | Propensity to move | Crime levels | Score |
|---|---|---|---|---|---|---|---|---|---|---|---|---|---|
| 1 | 1 | Edinburgh | City of Edinburgh | Scotland | C | C | A | A | A | A | A | C | 76% |
| 2 | 5 | Aberdeen | Aberdeen City | Scotland | A | B | E | B | A | A | A | C | 75% |
| 3 | 7 | Greater Bristol | South Gloucestershire | South West | D | A | B | A | B | B | A | D | 70% |
| 4 | 4 | Devizes | Wiltshire | South West | D | A | C | A | A | D | B | D | 69% |
| 5 | 3 | Harrogate | Harrogate | Yorkshire and the Humber | D | A | C | A | B | D | D | D | 69% |
| 6 | 36 | Bath | Bath and north-east Somerset | South West | D | A | D | B | B | B | A | D | 68% |
| 7 | 2 | Crewe | Cheshire East | North West | C | B | D | A | A | D | D | C | 67% |
| 8 | 11 | Inverurie | Aberdeenshire | Scotland | B | A | E | A | B | E | D | C | 67% |
| 9 | 8 | Stockport | Stockport | North West | C | C | A | A | A | B | D | B | 67% |
| 10 | 6 | Chester | Cheshire West and Chester | North West | C | C | D | A | A | C | D | B | 67% |
| 11 | 28 | Swansea | Swansea | Wales | B | C | A | A | B | B | B | B | 67% |
| 12 | 18 | Cardiff | Cardiff | Wales | C | D | C | A | A | A | A | A | 67% |
| 13 | 15 | Glasgow | Glasgow City | Scotland | A | E | C | A | A | A | A | C | 67% |
| 14 | 14 | Leeds | Leeds | Yorkshire and the Humber | B | D | B | A | A | A | A | A | 66% |
| 15 | 20 | York | York | Yorkshire and the Humber | C | B | D | B | A | B | B | C | 66% |
| 16 | 9 | Hamilton | South Lanarkshire | Scotland | A | E | A | A | A | B | D | C | 66% |
| 17 | 59 | Brighton | Brighton and Hove | South East | E | C | B | B | A | A | A | A | 66% |
| 18 | 17 | Perth | Perth and Kinross | Scotland | B | B | D | A | B | C | D | C | 65% |
| 19 | 19 | Clevedon | North Somerset | South West | C | B | D | B | B | D | A | D | 65% |
| 20 | 65 | Newcastle upon Tyne | Newcastle upon Tyne | North East | A | D | C | A | A | A | A | A | 65% |
| 21 | 13 | Sale | Trafford | North West | D | C | B | A | A | B | C | C | 64% |
| 22 | 39 | Lancaster | Lancaster | North West | B | B | A | B | B | B | B | B | 64% |
| 23 | 30 | London | Wandsworth | London | E | C | C | B | A | A | A | C | 64% |
| 24 | 12 | Nottingham | Rushcliffe | East Midlands | C | A | A | D | E | B | B | E | 64% |
| 25 | 21 | Kirkcaldy | Fife | Scotland | A | E | B | A | A | B | D | C | 64% |
| 26 | 16 | Beverley | East Riding of Yorkshire | Yorkshire and the Humber | B | B | D | A | A | E | E | E | 63% |
| 27 | 10 | Warrington | Warrington | North West | B | C | B | A | B | B | D | B | 63% |
| 28 | 22 | Chorley | Chorley | North West | B | B | B | B | D | B | D | C | 63% |
| 29 | 25 | Paisley | Renfrewshire | Scotland | A | E | A | B | B | A | C | C | 63% |
| 30 | 76 | Sheffield | Sheffield | Yorkshire and the Humber | B | D | D | A | A | A | A | A | 63% |
| 31 | 29 | Aylesbury | Aylesbury Vale | South East | D | B | B | A | D | D | A | E | 62% |
| 32 | 44 | Wokingham | Wokingham | South East | E | A | D | B | D | D | A | E | 62% |
| 33 | 24 | St. Albans | St Albans | East of England | E | A | B | B | C | C | C | C | 62% |
| 34 | 31 | Loughborough | Charnwood | East Midlands | C | B | B | B | C | B | A | D | 62% |
| 35 | 45 | Preston | Preston | North West | A | D | C | B | B | A | A | A | 62% |
| 36 | 47 | Durham | County Durham | North East | A | D | D | A | A | C | D | B | 62% |
| 37 | 56 | Abingdon | Vale of White Horse | South East | D | A | A | C | D | D | B | E | 62% |
| 38 | 33 | Liverpool | Sefton | North West | B | D | A | A | A | A | E | B | 62% |
| 39 | 43 | Huddersfield | Kirklees | Yorkshire and the Humber | A | D | C | A | A | C | C | B | 62% |
| 40 | 41 | Bolton | Bolton | North West | A | D | A | A | A | B | C | A | 61% |
| 41 | 64 | Newcastle upon Tyne | North Tyneside | North East | A | D | B | B | B | A | D | A | 61% |
| 42 | 52 | Stirling | Stirling | Scotland | B | C | E | C | C | C | C | C | 61% |
| 43 | 70 | Prenton | Wirral | North West | B | E | D | A | A | A | D | B | 61% |
| 44 | 55 | Twickenham | Richmond upon Thames | London | E | B | B | C | A | A | B | D | 61% |
| 45 | 38 | Stafford | Stafford | West Midlands | C | B | B | C | D | D | D | D | 61% |
| 46 | 53 | Wallingford | South Oxfordshire | South East | E | A | C | B | C | E | B | E | 61% |
| 47 | 35 | Livingston | West Lothian | Scotland | A | D | B | B | C | B | D | C | 61% |
| 48 | 48 | Stockton-on-Tees | Stockton-on-Tees | North East | A | E | A | B | B | B | C | A | 61% |
| 49 | 66 | Derby | Derby | East Midlands | B | E | C | A | A | A | A | A | 61% |
| 50 | 34 | Reading | West Berkshire | South East | E | A | E | B | C | D | B | E | 61% |
Methodology
CACI’s ranking combines the affordability of property with data on quality of life, including employment levels, provision of local amenities and public transport accessibility.
The affordability index was calculated by analysing the relationship between average house price and average income.
Other variables used were employment levels, internet connectivity and wi-fi speed data as well as the number of schools and retailers, pubs, restaurants and other amenities. Each town was given an A to E grade for each variable.
The methodology is consistent with previous years, apart from the addition of one new variable: national crime figures, based on data from local police forces.
CLICK HERE TO SEE TO SEE ANALYSIS OF THE TOP 5 LOCATIONS
CLICK HERE TO SEE THE TOP LOCATIONS FOR FIRST-TIME BUYERS AND DOWNSIZERS
Hot Housing Index 2018: South East closes in on north and Scotland
- 1
 Currently reading
Hot Housing Index 2018: South East closes in on north and Scotland
- 2
- 3


No comments yet